|
| These screen shots
show the exact way in
which the signals are given by the 'RH FTSE Futures Program' and most importantly the timing of the signals relative to the changes in the actual
index. We have included shots which show the futures program being traded
in three different ways, each in conjunction with an additional program. This
illustrates how drawdowns can be reduced and also provides different methods to
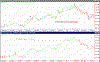
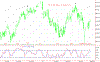
suit the traders temperament. The RH.Futures Trading Program on the FTSE 100 Index Future. B.1.Chart. Explanation of Signals.B1.The Blue 'Sign of Strength'
signal indicates that the market is likely to rise and the black 'Consolidation
'signal shows that the trend is slowing down and may actually reverse. The
trader can be profitably in the market for this period but will experience some
draw down. To reduce these drawdowns we include the 'RH. Paint Bar Trend
Indicator' which takes a shorter
time frame into account and changes the colour of the price bars as the market
corrects. If a long trade is in progress when a red bar appears
it can be closed out until the bar turns back to green. This may result in some small
losses but protect against a large drawdown which could be the start of a change
in market direction rather than a correction.
To
next screen shot:-
Select one Screen shot at a time to down
load the
|
|
|
|
* *Return to FTSE 100 Futures start page. |